Help with Pipedream chart
![]() 11 posts, 2 voices
11 posts, 2 voices
|
|
This ought to be simple, but I can’t see it. I have a spreadsheet with two columns – the left one is frequency, the right one gain. I want to plot the frequency response, i.e. left column horizontally, right column vertically. Pipedream insists on plotting row number horizontally, and both data columns vertically. How do I change this. (I also tried in Excel and got even more confused.) |
|
|
PipeDream always creates a chart based on the default settings (with the default default being of type Bar). Create the chart, which will have two sets of Bars, then from the Gallery menu, select Scatter and an appropriate combination of lines and points. Fireworkz will allow you to choose the type of chart at chart creation time. I wouldn’t advise using PipeDream unless you are a dyed-in-the-wool type of user! |
|
|
Thanks. That does it. It’s a pretty awful frequency response though.
I always thought of that as a line graph, so it’s the terminology that has me confused.
I am. I still find Fireworkz cumbersome. The only time I use it is to pretty-print Pipedream sheets, e.g. printing negative numbers in red, which Pipedream doesn’t do, in spite of displaying them that way. |
|
|
In most spreadsheet terminologies, a line chart is one where sets of y-values are plotted against equally spaced category values (like a bar or column chart). X-Y or Scatter usually denotes a graph where y-values are plotted against their associated x-value. |
|
|
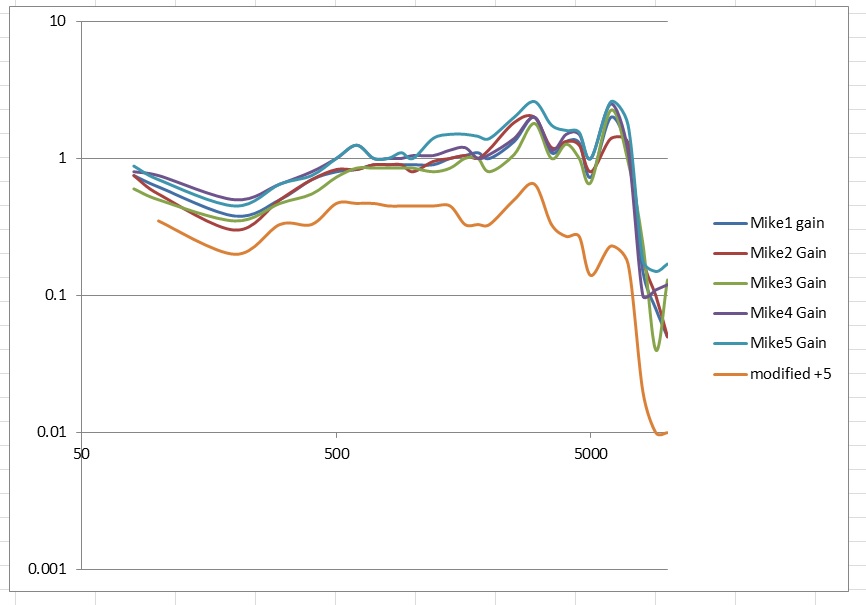
So I have still got some problems using Pipedream for this. Knowing that I need a scatter graph has allowed me to use Excel successfully. Several things I want to do, but can’t get to work in PD4 are to plot several values against frequency – selecting 3 columns produces a chart with the first column as X, and the second visible as Y. The third is invisible, even when the line style is changes to thick and red. The other thing is to use logarithmic scales for both X and Y. I resorted to saving each chart in turn as a draw file, then using draw to combine the lines from each. The scale is still linear however. Before discovering that Excel can do all this, I was looking for something I recall seeing, which is a library that allows BASIC to produce Draw files. I can’t recall the name, which somewhat impedes searches. The result: |
|
|
PipeDream doesn’t have a way of creating a chart in one go that plots a number of y-values against each x-value. In this instance you would have to construct a source table containing the appropriate number of x,y column pairs (by referencing the original data multiple times in the case of the x columns) and chart that. [Fireworkz allows multiple y-values for each x-value as a choice during chart creation. PipeDream chart functionality is stuck further back in the past, like around 1992.] Alternatively, but somewhat faffier to my mind, create the chart using the first x,y column pair, then mark the x-data again and Add to Chart, mark the second y-data and Add to Chart, … (https://croftnuisk.co.uk/coltsoft-docs/pipedream/RefGuide/content/charts.html#Adding) You can select each value axis (x/y) and select linear or logarithmic scaling independently. |
|
|
A new version of PipeDream is available for all you luddites. :-) This one prints negative numbers in red – and not blue! I think that we didn’t have a colour printer when that code was written and nobody ever told us about this bug! |
|
|
Thanks for that. One thing I’ve not been able to solve – when I double-click a csv file, it launches Fireworkz. I would prefer it to launch into Pipedream. I did try editing the run/boot files to change the run action, but it doesn’t work. It’s been a while since, and I’m a bit hazy on the details, but it seems that Pipedream doesn’t respond correctly to the DataLoad message for csv files. I think it runs the application, but doesn’t load the file. And I think it does something different, but still not correct, when Pipedream is already on the iconbar. |
|
|
PipeDream only claims (both through registering Fireworkz does register a claim for CSV file type iff one hasn’t already been made, which will depend on boot LookAt order etc. If Fireworkz is already loaded and is registered as the handler, it will import broadcast DataOpen CSV files – however if something else has registered interest in CSV, Fireworkz will ignore broadcast CSV files and let them handle them. Something we don’t seem to have solved is determining which application should process file types that aren’t truly registered to an application. I could extend PipeDream to use the same internal mechanism as Fireworkz for non-owned files that are broadcast, that is, test to see if the corresponding |
|
|
I’d vote for that, if it isn’t going to be a lot of work. |
|
|
If it’s going to be of use, then I’m up for it. |